J. Carter1, J. Pan2, S. Rai2, S. Galandiuk1 1University Of Louisville School Of Medicine,Department Of Surgery, Division Of Colorectal Surgery,Louisville, KY, USA 2University Of Louisville School Of Public Health And Information Sciences,Department Of Bioinformatics And Biostatistics,Louisville, KY, USA
Introduction:
Clinicians and researchers should have basic knowledge of research methodology used to evaluate the efficacy of diagnostic tests. In order to help understand and more correctly interpret statistics reported in clinical studies, we provide a simple, yet comprehensive, explanation of common research methodology involving receiver operating characteristic (ROC) curves. ROC curves are most frequently used in medicine as a quantitative method of evaluating diagnostic tests. While this type of statistical analysis is widely used in surgical research and publication, in fact, many of these methods are not fully understood by clinicians or researchers.
Methods:
In order to demonstrate the interpretation of an ROC curve we utilized results from a plasma-based test developed to diagnose colorectal cancer. Blood samples were taken from 67 patients, 18 patients with colorectal cancer and 49 patients with other types of cancer (breast, lung or pancreas). Using plasma miRNA as biomarkers, a model was developed to predict from which patients the blood sample had come from. ROC curves were generated to determine the accuracy of this plasma test. ROC curves are made by plotting sensitivity (true positive rate) on the y-axis, and 1-specificity (false positive rate) on the x-axis. Each point plotted on the ROC curve represents a sensitivity/specificity pair corresponding to a particular threshold cut off. It is generally accepted that at least 100 pair values are generated to create a curve; note that more pair values provide a better estimate of area under the curve (AUC).
Results:
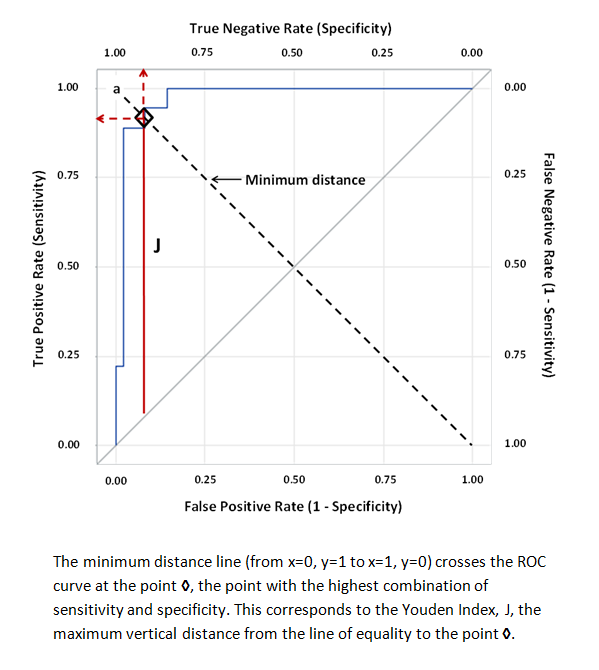
Curves that approach closest to coordinate (x=0, y=1) are more highly predictive, whereas curves that lie close to the line of equality indicate that the result is no better than chance. The optimum sensitivity and specificity can be determined as the point where the minimum distance line crosses the ROC curve (see figure). This point corresponds to the Youden Index, J, a function of sensitivity and specificity commonly used to rate diagnostic tests. The AUC is used to quantify the overall ability of a test to discriminate between two outcomes.
Conclusion:
By following these simple guidelines, interpretation of ROC curves will be less difficult and more useful when writing, reviewing or interpreting scientific papers. Parameters such as test sensitivity and specificity can be obtained from ROC curves and can be helpful in deciding whether a diagnostic test is acceptable for use.