T. O. Mitchell1, J. L. Holihan1, E. P. Askenasy2, J. A. Greenberg3, J. N. Keith4, R. G. Martindale5, J. Roth6, B. E. Henchcliffe1, C. W. Hannon1, J. Mo1, M. K. Liang1 1University Of Texas Health Science Center At Houston,Department Of Surgery,Houston, TX, USA 2Baylor College Of Medicine,Department Of Surgery,Houston, TX, USA 3University Of Wisconsin,Department Of Surgery,Madison, WI, USA 4University Of Iowa,Department Of Surgery,Iowa City, IA, USA 5Oregon Health And Science University,Department Of Surgery,Portland, OR, USA 6University Of Kentucky,Department Of Surgery,Lexington, KY, USA
Introduction: Current risk assessment models for surgical site occurrence (SSO) and surgical site infection (SSI) following ventral hernia repair (VHR) have limited external validation. Our aim was to determine 1) if existing models stratify patients into groups by risk and 2) which model best predicts the rate of SSO and SSI.
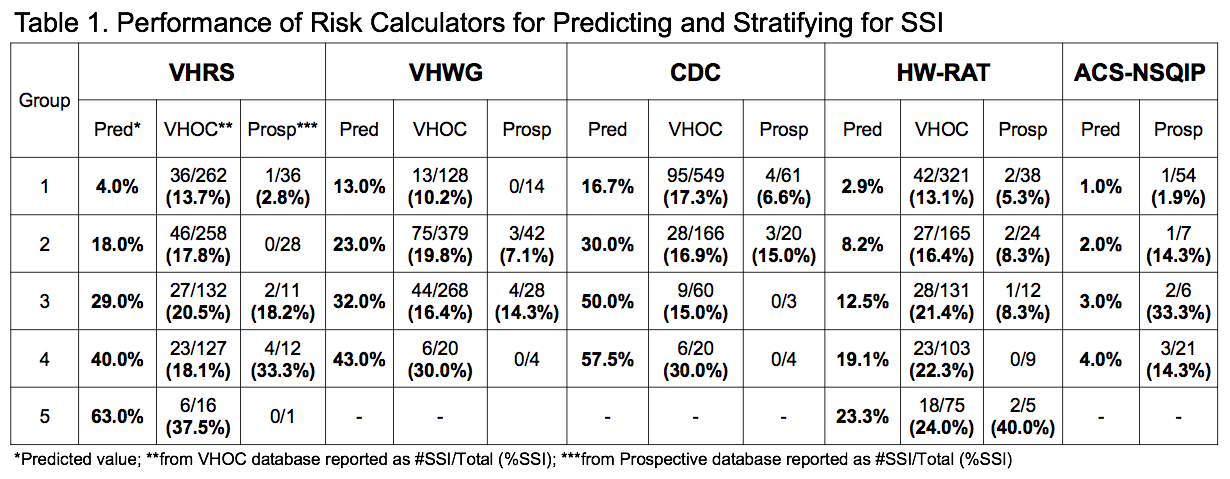
Methods: Patients who underwent VHR and were followed for at least one month were included. Using two datasets–a retrospective multicenter database (Ventral Hernia Outcomes Collaborative; VHOC) and a single-center prospective database (Prospective)–each patient was assigned a predicted risk with each of the following models: Ventral Hernia Risk Score (VHRS), Ventral Hernia Working Group (VHWG), Centers for Disease Control (CDC) Wound Class, and Hernia Wound Risk Assessment Tool (HW-RAT). Patients in the Prospective database were also assigned a predicted risk from the American College of Surgeons National Surgical Quality Improvement Project (ACS-NSQIP). Areas under the receiver operating characteristic (ROC) curve (AUC) were compared to assess the predictive accuracy of the models for SSO and SSI. Pearson’s Chi-Square was used to determine which models were able to risk-stratify patients into groups with significantly differing rates of actual SSO and SSI.
Results: The VHOC database (n=795) had an overall SSO and SSI rate of 23% and 17%. The AUCs were low for SSO (0.56, 0.54, 0.52, 0.60) and SSI (0.55, 0.53, 0.50, 0.58). The VHRS (p=0.01) and HW-RAT (p<0.01) significantly stratified patients into tiers for SSO while the VHWG (p<0.05) and HW-RAT (p<0.05) stratified for SSI (Table 1). In the Prospective database (n=88), 14% and 8% developed a SSO and SSI. The AUC were low for SSO (0.63, 0.54, 0.50, 0.57, 0.69) and modest for SSI (0.81, 0.64, 0.55, 0.62, 0.73). The ACS-NSQIP (p<0.01) stratified for SSO while the VHRS (p<0.01) and ACS-NSQIP (p<0.05) stratified for SSI. In both databases VHRS, VHWG, and CDC overestimated risk of SSO and SSI while HW-RAT and ACS-NSQIP underestimated risk for all groups.
Conclusion: All five existing predictive models have limited ability to risk-stratify patients and accurately assess risk of SSO. However, both the VHRS and ACS-NSQIP demonstrate modest success in identifying patients at risk for SSI. Continued model refinement is needed to improve upon the two highest performing models (VHRS and ACS-NSQIP) along with investigation to determine if modifications to perioperative management based on risk stratification can improve outcomes.