P. W. Lu1,2, J. C. McCarty3, A. C. Fields1, M. Azzeh4, J. Yoo1, J. E. Goldberg1, J. Irani1, R. Bleday1, N. Melnitchouk1,2 1Brigham And Women’s Hospital,Division Of Colorectal Surgery,Boston, MA, USA 2Brigham And Women’s Hospital,Center For Surgery And Public Health,Boston, MA, USA 3St. Elizabeth’s Medical Center,Department Of Surgery,Boston, MA, USA 4Mohammed Bin Rashed University of Medicine and Health Sciences,College Of Medicine,Dubai, UAE, United Arab Emirates
Introduction: Colorectal cancer remains the third leading cause of cancer related mortality in the United States. Surgical resection is a mainstay of colorectal cancer treatment and R0 resection is an important prognostic factor for survival. Prior studies have shown improved outcomes in patients undergoing surgery for colorectal cancer by colorectal surgical specialists compared to non-specialized surgeons. Efforts to further standardize care have been made, such as the introduction of the National Accreditation Program for Rectal Cancer. However, such actions may result in further centralization of colorectal cancer care leading to increased disparities in access to care. We aim to examine the geographic distribution of colorectal surgeons its relationship to county level sociodemographic characteristics in the United States.
Methods: The Area Resource File, which utilizes data drawn from the American Medical Association Masterfile was used to identify the number and location of colorectal surgeons practicing throughout the United States in 2016. Sociodemographic characteristics at the county level were drawn from the United States Census survey information. Breakdown of county level characteristics into quartiles allowed comparison between the lowest density and highest density for variables of interest. Bivariable and multivariable linear regression were used to evaluate for associations between the number of colorectal surgeons and county characteristics.
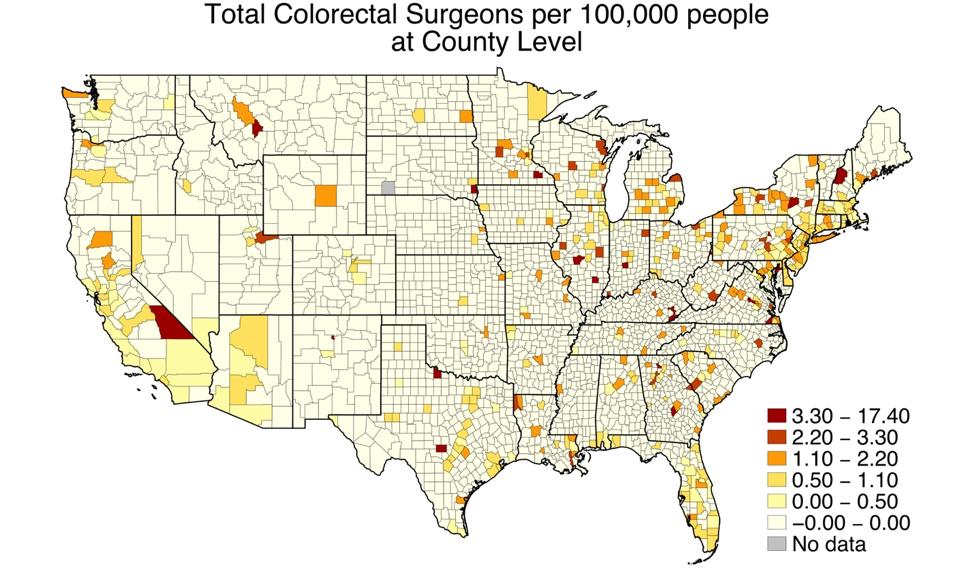
Results: There was an average of 0.16 (standard deviation 0.69) colorectal surgeons per 100,000 people per county (Figure). In bivariable analysis, counties with the most uninsured individuals (-0.2 per 100,000, 95%CI -0.27, -0.13) had significantly fewer colorectal surgeons, whereas counties with the most non-white individuals (0.11 per 100,000, 95%CI 0.05, 0.18), most individuals with a college education (0.44, 95%CI 0.37, 0.51) and highest median income (0.30 per 100,000, 95%CI 0.24, 0.38) were significantly associated with a higher density of colorectal surgeons. In multivariable analysis, counties with the most uninsured individuals (-0.15, 95%CI -0.23, -0.07) continued to have lower colorectal surgeon density while the counties with the most non-white individuals (0.15 per 100,000, 95%CI 0.08, 0.23) and most college educated individuals (0.35 per 100,000, 95%CI 0.27, 0.44) had significantly higher colorectal surgeon density.
Conclusion: Geographic and sociodemographic variability exists in the distribution of colorectal surgeons in the United States. Such variability may be contributing to disparities in access to specialized colorectal care. This information must be taken into account when implementing national accreditation programs.