18.17 Surgical Needs in Rural India: A Population-Based Survey in Nanakpur, Haryana

S. E. Cherukupalli1, M. Bhatia2, S. Gupta3,4, N. Nagarajan5, M. Boeck1,6,7, S. Sharma8,9, B. C. Nwomeh4,10, J. Thakur11, M. B. Shapiro1, A. Bhalla11, M. Swaroop1 1Northwestern University Feinberg School Of Medicine,Department Of Surgery, Division Of Trauma And Critical Care,Chicago, IL, USA 2Texas Tech University Health Sciences Center School Of Medicine,Lubbock, TX, USA 3University Of California, San Francisco, East Bay,Oakland, CA, USA 4Surgeons Overseas,New York, NY, USA 5Johns Hopkins University School Of Medicine,Department Of Surgery,Baltimore, MD, USA 6Brigham And Women’s Hospital,Center For Surgery And Public Health,Boston, MA, USA 7New York Presbyterian Hospital-Columbia,Department Of Surgery,New York, NY, USA 8Boston Children’s Hospital,Department Of Plastic Surgery,Boston, MA, USA 9Harvard Medical School,Department Of Global Health And Social Medicine,Boston, MA, USA 10Nationwide Children’s Hospital,Columbus, OH, USA 11Postgraduate Institute Of Medical Education And Research,Chandigarh, HARYANA, India

Introduction:
Recent global estimates show an astounding five billion people lack access to safe, quality and timely surgical care. The rates of major surgeries in low- and middle-income countries (LMICs) are much lower than those of more developed nations. Surveys at the community level provide a more accurate measure of unmet surgical need compared to facility-based surveys. This pilot study aimed to assess the local burden of surgical disease in a rural region of India through the Surgeons OverSeas Assessment of Surgical need (SOSAS) population-based survey tool.

Methods:
The study was undertaken between June and July 2015 in Nanakpur, Haryana. The region was divided into three sectors, with eight clusters each for sampling. Two clusters per sector were randomly selected for a total of 50 households (93 respondents) interviewed. The head of household provided demographic data, and surgical histories in six distinct anatomical regions were obtained from two household members. Questions were modified from the SOSAS survey to better capture distinct characteristics of Nanakpur’s population. We defined current surgical need as a self-reported surgical problem present at the time of the interview and unmet surgical need as a surgical problem in which the respondent did not access care. Categorical and continuous variables were analyzed using Pearson’s chi-squared and Kruskal Wallis tests, respectively.

Results:
One hundred percent of households selected for the survey participated, with a total of 93 individuals and a median age of 35 years (IQR 26-50). Eighty-six percent were female, 59.1% literate and 23.7% employed. Twenty-eight individuals (30.1%; 95% CI: 21.0-40.5) indicated they had a current surgical need (body region: face 2, chest/breast 1, back 1, abdomen 3, groin/genitalia 4, extremities 17). Those with a current surgical need had a higher median age (46.5 vs. 33 years, p=0.034) and lacked funds to travel to a tertiary center (64.3% vs. 32.4%, p=0.041). Once transport was available, the median travel time to a tertiary center was 60 minutes (IQR 45–90). Six individuals had an unmet surgical need (6.5%; 95% CI: 2.45-13.5).

Conclusion:
The SOSAS tool has been used to estimate surgical needs at the population level in multiple regions across the globe. This pilot study, the first in India, highlights a significant burden of surgical disease in the remote area of Nanakpur. These data are useful preliminary evidence to highlight the urgent need to strengthen surgical systems in rural parts of India. Further studies should be conducted to better estimate the burden of surgical diseases throughout India, to accurately inform policymakers of the need to improve access to care.
18.14 Quantifying Surgical Care Needs for Refugees and Other Displaced Persons

Y. A. Zha1,2, E. Lee1,3, K. N. Remick4,5, D. H. Rothstein6,7, D. Guha-Sapir8, R. S. Groen9, D. K. Imagawa2, G. Burnham1, A. L. Kushner1,10,11 8Centre For Research On The Epidemiology Of Disasters – Université Catholique De Louvain,Brussels, , Belgium 9Johns Hopkins Hospital,Department Of Gynecology & Obstetrics,Baltimore, MD, USA 10Columbia University College Of Physicians And Surgeons,Department Of Surgery,New York, NY, USA 11Surgeons OverSeas,New York, NY, USA 1Johns Hopkins Bloomberg School Of Public Health,Department Of International Health,Baltimore, MD, USA 2University Of California – Irvine School Of Medicine,Department Of Surgery,Irvine, CA, USA 3University Of Southern California,Department Of Surgery,Los Angeles, CA, USA 4Uniformed Services University Of The Health Sciences,Department Of Surgery,Bethesda, MD, USA 5Combat Casualty Care Research Program,Ft. Detrick, MD, USA 6Women And Children’s Hospital Of Buffalo,Department Of Pediatric Surgery,Buffalo, NY, USA 7State University Of New York At Buffalo,Department Of Surgery,Buffalo, NY, USA

Introduction:
According to United Nations High Commissioner for Refugees (UNHCR), 59.5 million people worldwide were displaced from their homes due to conflict, persecution, violence, and human rights violations at the end of 2014. This vulnerable population suffers from poor health conditions, many of which are surgically treatable. The recently released Lancet Commission on Global Surgery proposed a target capacity of 5,000 operations per 100,000 people annually by 2030 to meet the demands of the global burden of surgical disease. Based on this value, we sought to estimate the minimum surgical needs of refugees, internally displaced persons (IDPs), and asylum seekers.

Methods:
Using the UNHCR database, the numbers of refugees, IDPs, and asylum seekers at the end of 2014 were identified. Data on the age and gender distribution of this population were also recorded. The numbers of displaced persons were categorized by the top countries of residence. Using the proposed annual minimum target of 5,000 operations per 100,000 population, the numbers of major surgical procedures needed per year were calculated.

Results:
For the 59.5 million displaced persons, we calculated that at least 2.98 million operations are needed each year. The minimum numbers of surgeries required per year for the countries with the largest populations of displaced individuals include: Syria (397,000 surgeries), Colombia (302,000 surgeries), Iraq (201,000 surgeries), Democratic Republic of Congo (181,000 surgeries), and Pakistan (148,000 surgeries). The numbers of displaced persons and estimated operations needed annually by category are shown in Table 1. Gender distribution for displaced individuals shows a nearly equal breakdown of males (50.2%) and females (49.8%). Additionally, 51% of refugees were children (age less than 18 years).

Conclusion:
An estimated minimum of nearly 3 million operations are required each year to meet the large surgical needs of refugees, IDPs, and asylum seekers. Obstetrical/gynecological and pediatric surgical expertise will likely be in high demand due to the large proportion of women and children among those displaced. Most displaced persons are hosted in countries with inadequate healthcare infrastructure and where surgical care is likely to fall short of the need. We recommend governments and non-governmental organizations consider these figures when providing humanitarian assistance and allocating resources. In addition, including surgical need with data collected on displaced persons can help the implementation, monitoring, and evaluation of humanitarian surgery programs.

17.17 Variation In MRI Use For Cervical Spine Clearance In Obtunded Blunt Trauma Patients

A. Albaghdadi1, J. Canner1, E. B. Schneider1, C. B. Feather1, J. Odden1, E. R. Haut1 1Johns Hopkins University School Of Medicine,Baltimore, MD, USA

Introduction:

Controversy remains about the ideal approach for cervical spine clearance in obtunded, blunt, adult trauma patients. An EAST practice management guideline was recently published suggesting that MRI is not necessary in hopes of standardizing care. We aimed to identify national variation of MRI use to clear the c-spine in obtunded trauma patients and describe patient- and hospital-level factors associated with its use.

Methods:

We conducted a retrospective review of the NTDB from 2007 to 2012. We included blunt trauma patients >=18 years, treated at level 1 or 2 trauma centers (TCs), with a GCS<=8, Head AIS>3 and mechanically ventilated >72 hours. The proportion of patients undergoing MRI at each hospital was calculated. Multi-level modeling was used to identify patient- and hospital- level factors associated with MRI use.

Results:

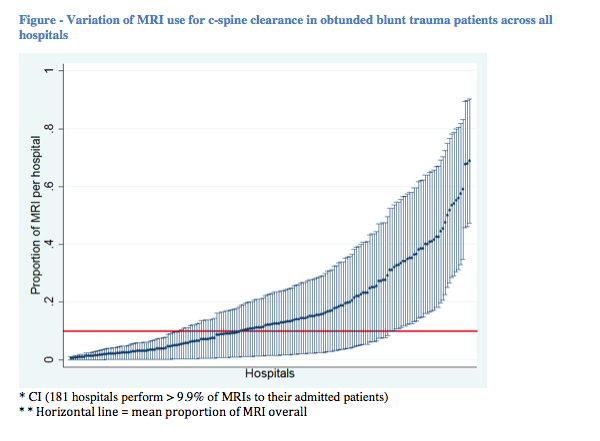
We included 32,125 patients treated at 395 unique TCs. The mean proportion of MRI over the entire sample was 9.9%. Amongst the 181 hospitals (57.8% of all admissions) that performed and reported MRIs, the proportions of patients who received MRI per hospital ranged from 0.5-68.4%. (Figure) Younger patients, MVC and pedestrian injuries were more likely to receive an MRI. Injury severity (ISS) was not associated with MRI use. Hospitals in the northeast, level 1 TCs, and non-teaching hospitals were more likely to perform MRI.

Conclusion:

After controlling for patient-level characteristics, variation remained in MRI use based on hospital specific, geographic, trauma center level, and teaching status characteristics. Cervical spine clearance protocol implementation based on the new EAST guideline may standardize care, reduce variation in practices, and decrease healthcare costs.

17.12 Sports and Recreation-Related Ocular Injuries

R. S. Haring1,2,3,4, I. D. Sheffield5, J. K. Canner3, A. H. Haider1,2, E. B. Schneider1,2,3,4 1Harvard School Of Medicine,Brookline, MA, USA 2Brigham And Women’s Hospital,Center For Surgery And Public Health,Boston, MA, USA 3Johns Hopkins University School Of Medicine,Johns Hopkins Surgery Center For Outcomes Research,Baltimore, MD, USA 4Johns Hopkins Bloomberg School Of Public Health,Dept. Of Health Systems And Policy,Baltimore, MD, USA 5Brigham Young University,Provo, UT, USA

Introduction: Ocular injuries can have long-term sequelae and substantially impact quality of life. Currently available data on the incidence and overall burden of sports-related ocular trauma are limited or outdated. In 2015, the Centers for Disease Control and Prevention published a comprehensive model for the classification of sports and recreation-related injury. We applied this model to estimate and characterize the burden of sports and recreation-related (S/R) ocular injury in the United States.

Methods: Using the Nationwide Emergency Department Sample, we identified patients presenting with a diagnosis of ocular trauma from 2006-2012. We then examined ICD-9CM codes to identify individuals with S/R ocular injuries using the CDC’s comprehensive classification system. Age, sex, external mechanism of injury, type of S/R activity, and other factors were used to characterize and stratify injuries. Comparisons were made within and between injury strata across time. Data specific to individual team sports were not readily available until 2010; a subset was created to characterize those injuries from 2010-2012.

Results: A total of 287,718 ED visits associated with a diagnosis of S/R-related ocular injury occurred from 2006-2012. Males represented 78.8% of cases, and that proportion did not vary significantly across the 7-year period. The proportion of all ocular trauma cases that were S/R-related rose a relative 36.3%, from 3.8% of all injuries in 2006 to 5.2% in 2012. Overall, the leading single cause of S/R ocular injury was pedal cycling—an activity resulting in 34,965 (12.2%) S/R ocular injuries. The number of patients presenting cycling-related ocular injuries increased from 4,076 in 2006 to 5,623 in 2012. Among team sports, basketball resulted in the highest number of ocular injuries, with 17,018 patients presenting to the ED between 2010 and 2012. The next most common sport was baseball (12,734), followed by soccer (5,787), football (4,844), and watersports (2,063). During the study period, 291 patients were hospitalized with baseball-related ocular injury, 82 for basketball-related eye injury, 59 for soccer, and 45 for football-related injuries.

Conclusions: Despite an overall reduction in the number of all-cause ocular trauma cases reporting to the ED across the study period, the absolute number of S/R ocular trauma cases presenting for care increased significantly. The observed increase in S/R ocular trauma presentations appears to be driven in part by a 38.0% increase in the number of bicycle-related ocular injuries, which tend to be more severe (23.9% of cases resulting in hospitalization). Basketball remains the leading cause of S/R ocular injuries among the team sports, but hospitalization rates for baseball are 4.6 times higher than those for basketball (2.3% vs 0.5%). Efforts aimed at preventing serious vision-threatening injury may be most effectively focused on high energy S/R activities such as cycling and baseball.

15.12 The Potential for Trauma Quality Improvement: One Hundred Thousand Lives in Five Years

Z. G. Hashmi1, S. Zafar2, T. Genuit1, E. R. Haut4, D. T. Efron4, J. Havens3, Z. Cooper3, A. Salim3, E. E. Cornwell III2, A. H. Haider3 1Sinai Hospital Of Baltimore,Department Of Surgery,Baltimore, MD, USA 2Howard University Hospital,Department Of Surgery,Washington, DC, USA 3Brigham And Women’s Hospital,Department Of Surgery,Boston, MA, USA 4Johns Hopkins University School Of Medicine,Department Of Surgery,Baltimore, MD, USA

Introduction: Nationwide efforts at trauma quality improvement aim to reduce in-hospital trauma mortality. However, the magnitude of this mortality reduction at the national level remains largely unknown. Our objective was to determine a nationwide estimate of number of lives that could potentially be saved if high-mortality trauma centers improved their performance.

Methods: Adults with blunt/penetrating injuries included in the Nationwide Emergency Department Sample 2006-2010 were analyzed. Hospitals were classified as high, average or low-performers based on risk-adjusted in-hospital mortality using the standardized Trauma Quality Improvement Program (TQIP) benchmarking methodology. Generalized linear modeling, adjusting for demographics and injury severity characteristics, was then used to estimate the relative-risk of death for patients treated at high/average performing hospitals versus low-performing centers. Subsequently, weighted national estimates of preventable mortality were determined for each of the following; 1)Conservative model: low-performing hospitals improve to average-performing, 2)Intermediate model: low-performing hospitals improve to average and average improve to high-performing and 3)Best-case model: all hospitals improve to high-performing.

Results: A total of 9,992,202 trauma patients from 1771 hospitals were included. 151 (8.5%) hospitals were classified as high-performing, 1,506 (85.0%) as average and 114 (6.4%) as low-performing. For conservative and intermediate models, an estimated 4,323 and 16,697 trauma deaths, respectively, could be prevented annually. Additionally, if all hospitals were to deliver the highest quality of care, an estimated 19,686 lives could potentially be saved each year.

Conclusion: If all trauma centers achieved outcomes similar to those at the highest-performing centers, nearly 100,000 lives could be saved over 5 years. These national estimates demonstrate the tremendous societal benefits associated with provisioning high quality of trauma care. Concerted efforts aimed at the standardization and implementation of high quality trauma care should therefore be a priority.

15.04 Does Universal Insurance Attenuate Racial Disparities in Trauma Outcomes?

L. M. Kodadek1, W. Jiang2, C. K. Zogg2, S. R. Lipsitz2, J. S. Weissman2, Z. Cooper2, A. Salim2, S. L. Nitzschke2, L. L. Nguyen2, L. A. Helmchen3, L. Kimsey4, S. T. Olaiya4, P. A. Learn4, A. H. Haider2 3George Mason University,Department Of Health Administration And Policy,Fairfax, VA, USA 4Uniformed Services University Of The Health Sciences,Bethesda, MD, USA 1Johns Hopkins University School Of Medicine,Surgery,Baltimore, MD, USA 2Brigham And Women’s Hospital,Center For Surgery And Public Health,Boston, MA, USA

Introduction: Race and insurance status are both independent predictors of outcome disparities after traumatic injury, but it remains unclear whether universal insurance may attenuate racial disparities. We investigated for the presence of racial disparities in a cohort of adult trauma patients with TRICARE coverage (military health system insurance).

Methods: We identified patients (age ≥18), including uniformed service personnel, dependents and retirees, who were treated in the United States for non-combat index injuries between 2006 and 2010. Included patients had a primary diagnosis of traumatic injury (ICD-9 800-959.9) and an Injury Severity Score (ISS) ≥9. Patients with superficial injuries, foreign body injuries and late effects were excluded. Patient demographics as well as clinical and hospital characteristics were compared by race. Multilevel logistic regression, adjusting for potential confounding and accounting for clustering of patients within hospitals, determined whether race is an independent predictor of mortality, major morbidity or readmission following traumatic injury among patients with universal insurance coverage. Interaction between trauma outcomes by race and hospital type (civilian or military) was tested.

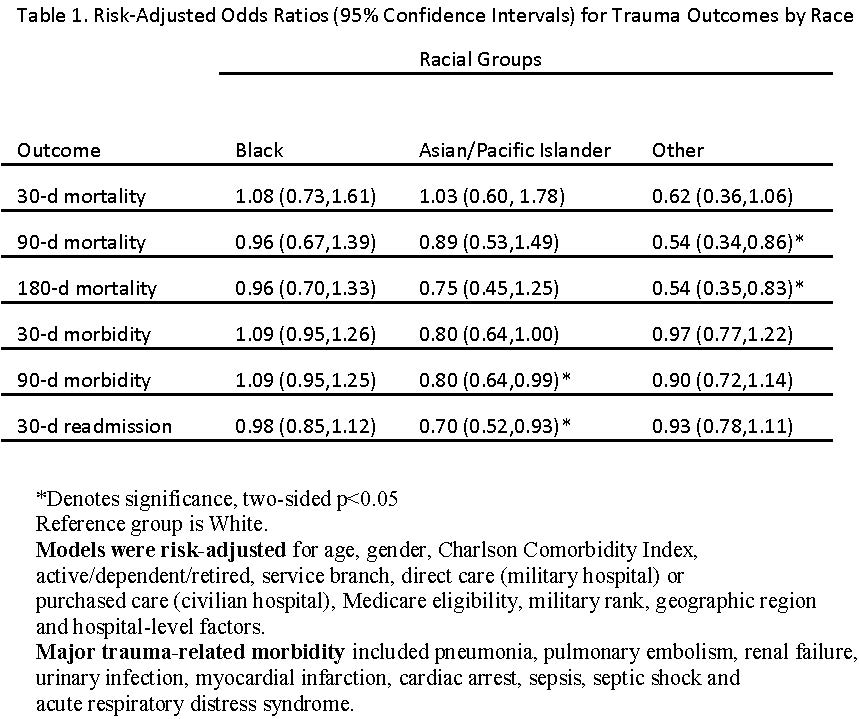
Results: Identified trauma patients (N=19,024) were young (58% of patients age <35), predominantly male (76%) and healthy (89% of patients had Charlson Comorbidity Index = 0); 77% were White, 13% Black and 5% Asian/Pacific Islander. The remaining 5% identified with other races. The largest proportion of patients was active duty or guard (64%) and received care at a civilian hospital (63%). Compared to White patients, minority patients admitted for primary trauma did not experience worse outcomes with respect to morbidity, mortality or readmission. Some groups experienced better outcomes than White patients: Asians/Pacific Islanders had significantly lower odds ratios of 90+ day morbidity and 30+ day readmission, while patients of minority races other than Black and Asian/Pacific Islander experienced lower mortality at 90 and 180 days. There was no significant interaction between race and hospital type (civilian versus military). Risk-adjusted regression results are presented in Table 1.

Conclusion: Universal military insurance coverage was associated with resolution of racial disparities in morbidity, mortality and readmission after traumatic injury. While unmeasured confounders, including socioeconomic status, may limit direct comparison with an injured civilian population, these findings highlight a role for universal insurance coverage for traumatic injury to mitigate known racial disparities in outcomes.

13.15 Predicting The Need For Perioperative Transfusion In Liver Surgery

M. Mavros1,2, A. Ejaz3, Y. Kim2, F. Gani2, T. M. Pawlik2 1MedStar Washington Hospital Center,Surgery,Washington, DC, USA 2Johns Hopkins University School Of Medicine,Surgery,Baltimore, MD, USA 3University Of Illinois At Chicago,Surgery,Chicago, IL, USA

Introduction: Blood loss and transfusion have traditionally been a concern when performing a hepatic resection. While many patients will have blood products crossmatched preoperatively, only a proportion will get transfused. We sought to create a score to predict need for transfusion.

Methods: Patients in the 2010-2013 American College of Surgeons National Surgical Quality Improvement Program undergoing liver surgery were analyzed. Multivariable models were constructed to identify independent predictors of perioperative transfusion (≥1 unit PRBCs intraoperatively or within 72 hours postoperatively). A scoring system to estimate odds of transfusion was constructed (n=16,679) and then validated (n=8,169).

Results: Among 24,848 cases analyzed, median age was 60 years and 52% were female. 9001 patients (36%) had a major hepatectomy and 6100 (25%) received a transfusion. Factors predictive of transfusion included preoperative hematocrit (OR 2.4), preoperative transfusion (OR 3.2), major hepatectomy (OR 1.6), extrahepatic surgery (OR 1.3), bleeding disorder (OR 1.8), ASA class (ASA 3-4 OR 1.3, ASA 5 OR 2.1), preoperative albumin, (OR 1.4) and alkaline phosphatase (OR 1.4). A weighted integer score was derived using these factors, which could predict with moderate accuracy the need for transfusion in the validation dataset: score 1 (reference): 9% likelihood of transfusion; score 2: 18%, OR 2.3; score 3: 28%, OR 4.1; score 4: 42%, OR 7.8; score 5: 66%, OR 20.1; AUC: 70.1%.

Conclusion: Up to 1 in 4 patients undergoing hepatic resection required a transfusion. A score derived from preoperative factors including patient comorbidities, laboratory values, and extent of surgery was associated with the need for transfusion.

13.14 Intraoperative Blood Loss: Impact on Long-Term Outcomes After Colorectal Liver Metastases Resection

G. MARGONIS1, Y. Kim1, F. Gani1, T. M. Pawlik1 1Johns Hopkins University School Of Medicine,Surgery,Baltimore, MD, USA

Introduction: The influence of intraoperative blood loss (IBL) on long-term outcomes of patients undergoing liver resection for colorectal cancer liver metastases (CRLM) remains not well defined. We sought to study the prognostic impact of intraoperative blood loss on long-term survival following resection of CRLM.

Methods: A total of 433 patients who underwent hepatic resection with curative intent for CRLM between 2000 and 2013 at a major hepatobiliary center were identified. Demographics data, operative details, intraoperative blood loss data, and long-term outcomes were collected and analyzed. IBL cutoff volume was calculated using chi square test analysis. Clinicopathologic predictors of IBL were identified using logistic regression. Overall survival (OS) was assessed using the Kaplan-Meier and Cox regression methods.

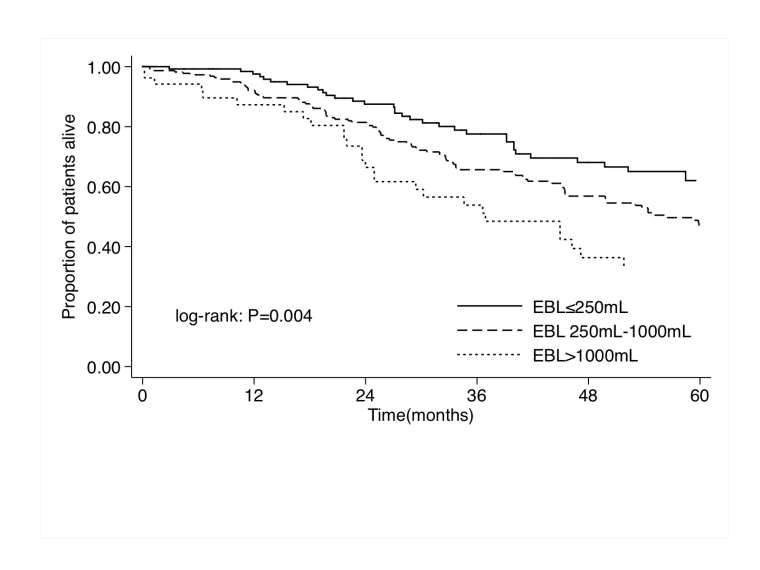
Results:Median patient age was 54 (IQR 44, 64) years, and the majority of patients were male (58.9%, n=255). At the time of surgery, the median IBL was 400 (IQR 200-800) mL. Intraoperatively, 146 (33.7%) patients had an IBL <250 mL, while 287 (66.3%) patients had an IBL ≥250 mL. On multivariate analysis, factors associated with IBL ≥250 mL included male sex (OR 2.62, 95%CI 1.69-4.08; P<0.001), tumor size >3cm (OR 1.88, 95%CI 1.18-2.99; P=0.01), and major hepatic resection (OR 3.07, 95%CI 1.93-4.90; P<0.001). At a median follow-up time of 30.6 months, median and overall 5-year survival were 59.9 months and 49.3%, respectively. Of note, IBL was associated with both median and 5-year survival (<250 mL: 70.5 months, 62.0% vs. 251-1000 mL: 56.4 months, 46.1% vs. >1000 mL: 36.9 month, 33.0%, respectively; P=0.004, Figure). On multivariable analysis, tumor specific factors such as primary tumor N stage (HR 1.42, 95%CI 1.04-1.95; P=0.03) and tumor size >3 cm (HR 1.48, 95%CI 1.11-1.98; P=0.01), as well as procedure factors such as use of ablation (HR 2.31, 95%CI 1.59-3.34; P<0.001) were associated with overall survival. Of note, IBL also remained an independent prognostic factor of long-term survival even after controlling for whether the patient did or did not receive a blood transfusion (HR 1.48, 95%CI 1.06-2.07; P=0.02).

Conclusion:The magnitude of IBL during CRLM resection was related to biologic characteristics of the tumor as well as the extent of surgery. Increased IBL during CRLM resection was an independent prognostic factor associated with a worse long-term survival.

12.18 Combining Loss of Muscle Mass and Muscle Attenuation to Predict Outcomes following HPB Surgery

L. Xu1, Y. Kim1, F. Gani1, G. A. Margonis1, D. Wagner1, S. Buttner1, T. M. Pawlik1 1Johns Hopkins University School Of Medicine,Surgery,Baltimore, MD, USA

Introduction: Skeletal muscle depletion (SMD) has been shown to be a powerful predictor of a poor prognosis. We sought to identify the prevalence of sarcopenia and low muscle attenuation (MA) among patients undergoing hepato-pancreatico-biliary (HPB) surgery, as well as the prognostic value of SMD for HPB surgery.

Methods: Patients undergoing HPB surgery between August 2011 and June 2014 with available preoperative (≤30 days) lumbar computed tomography (CT) images were identified. Total psoas volume (TPV) and average psoas density (PD) were measured using preoperative CT scans. Sarcopenia was defined as the lowest gender-specific quartile for TPV. Similarly, low MA was defined as the lowest gender-specific quartile for PD. SMD was defined as presence of both sarcopenia and low MA. Patients with missing data for TPV, PD, or BMI, and patients <18 years were excluded from the analysis. Clinical features, complications, short-term outcomes and overall survival of patients were collected.

Results: Of the 913 patients included, the median age was 63 years (IQR 53, 71) with 47.3% being male. Over two-thirds (n=633, 69.3%) of patients underwent surgery for a malignant disease. Patients undergoing surgery for a malignant disease were older (median 64 years vs. 59 years, p<0.001), and more likely to be male (57.2% vs. 42.5%, p<0.001). Of note, BMI was not different between patients undergoing surgery for malignant or benign disease (p=0.682). Sarcopenia and low MA were more common in patients with malignant disease (sarcopenia 27.7% vs. 19.3% in benign, p=0.007; low MA 27.5% vs. 19.3%, p=0.008). Among the entire cohort, patients presenting with SMD reported a higher incidence of postoperative complications (31.6% vs. 15.8% in non-SMD patients, p<0.001), as well as longer length of stay (median 11 days [IQR 7, 16] vs. 8 days [IQR 6, 12] in non-SMD patients, p<0.001). Among the patients undergoing surgery for malignant disease, patients with SMD had a higher risk of death than patients without SMD (HR 1.8, 95% CI 1.1-2.9; p=0.01). On multivariate analysis, SMD was remained as an independent predictor for both complication (OR 1.90, 95% CI 1.14-3.15; p=0.01) and a worse overall survival (HR 1.66, 95% CI 1.04-2.67; p=0.03).

Conclusions: Sarcopenia and low MA are more common in patients undergoing HPB surgery for malignant disease compared to patients with benign disease. SMD is an independent predictor of poor prognosis in patients undergoing HPB surgery.

12.04 Early versus Late Hospital Readmission after Combined Major Surgical Procedures

Y. Kim1, F. Gani1, A. Ejaz2, L. Xu1, J. K. Canner1, E. B. Schneider1, T. M. Pawlik1 1Johns Hopkins University School Of Medicine,Baltimore, MD, USA 2University Of Illinois At Chicago,Chicago, IL, USA

Introduction: Most studies report data on readmission within 30-days of discharge from the same hospital following a single procedure. Readmission after combined multiple surgical procedures is common, but data comparing patterns of readmission are rare. We therefore sought to define the incidence of early versus late hospital readmission among patients experiencing combined major surgeries.

Methods: Patients discharged after ten major surgical procedures (CABG, AAA, carotid endarterectomy, aortic valve replacement, esophagectomy, gastrectomy, pancreatectomy, pulmonary resection, hepatectomy, colorectal resection) between 2010 and 2012 were identified from a large employer-provided health plan. Unplanned readmissions among patients who underwent combined surgical procedures were analyzed.

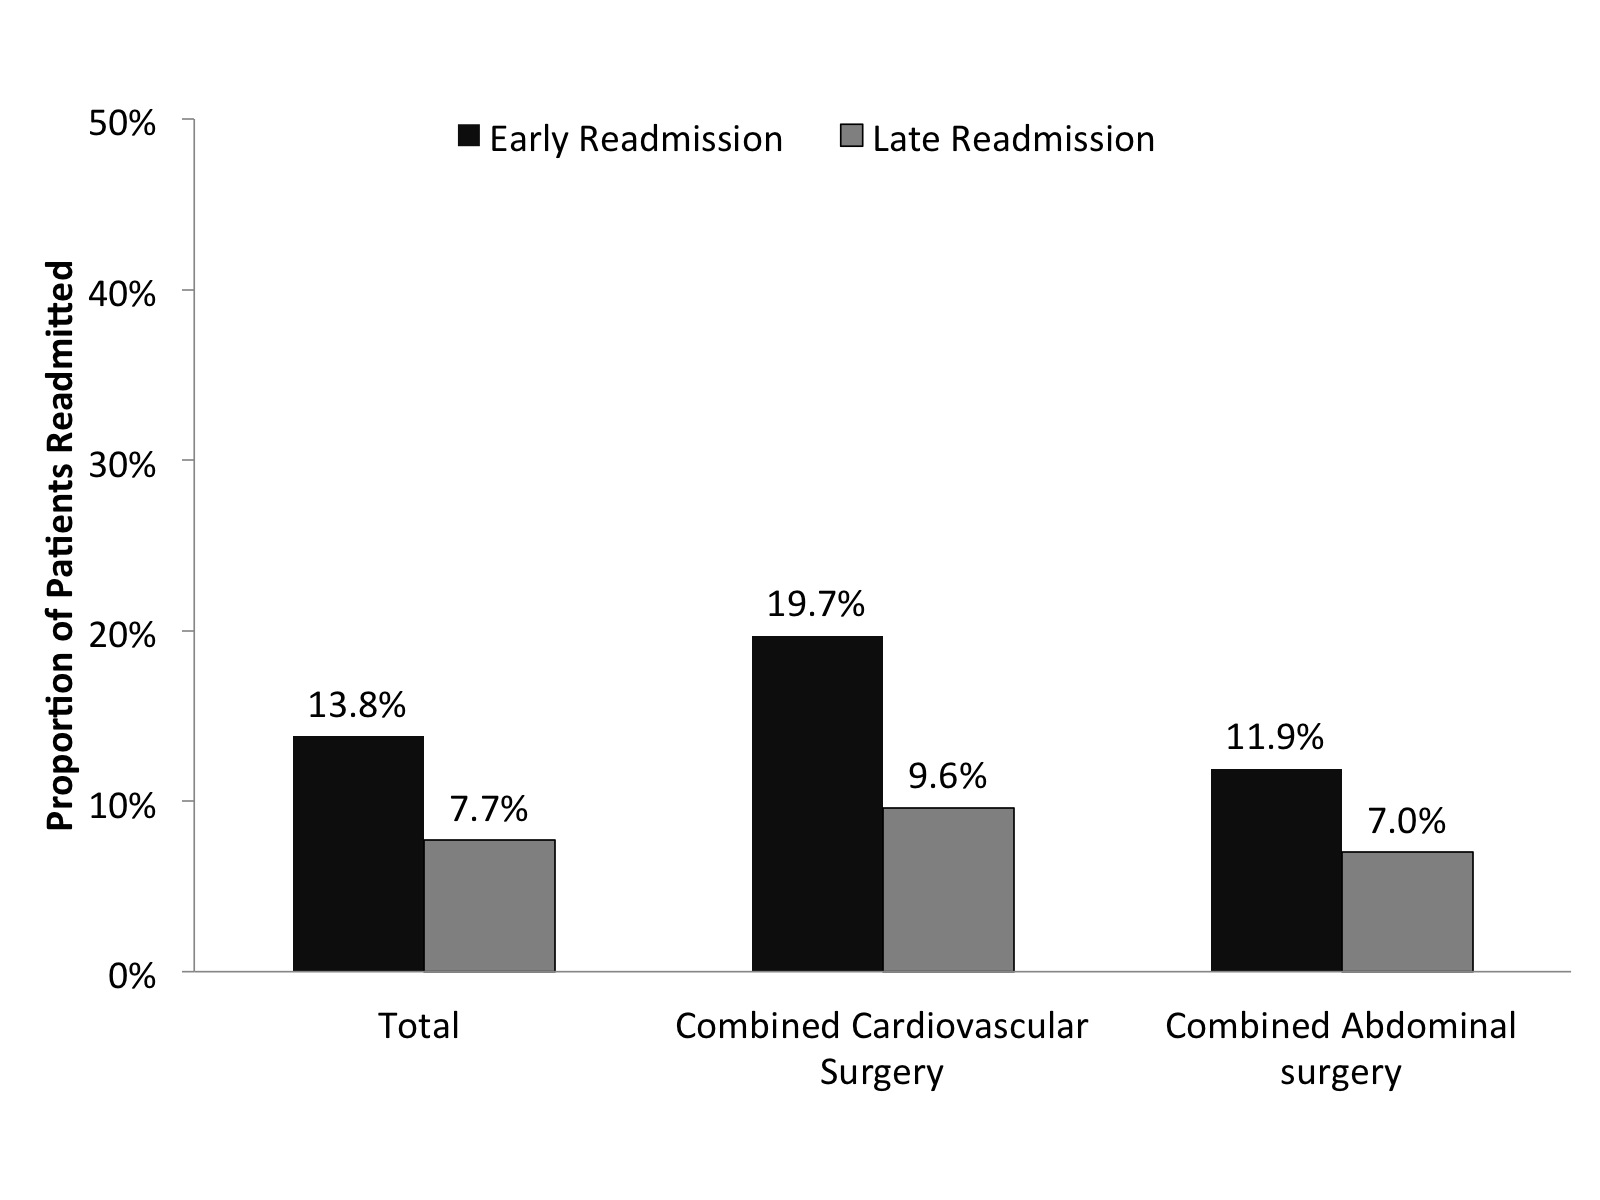
Results: 3,358 patients experiencing combined major surgeries were identified? median patient age was 59 years, 69.6% were male, and 53.6% had Charlson Comorbidity Index (CCI) of ≥2. Median length-of-stay (LOS) was 8 (IQR 6-13) days. 2,933 (84.4%) of patients were discharged home of which 41.0% (n=1,162) were discharged home under care. 3.8% (n=127) of patients had died during the index hospitalization. Among the 723 (21.5%) patients who experienced readmission, 465 (13.8%) had a readmission within 30-days while 258 (7.7%) were readmitted within 31-90 days (Figure). Median time to readmission was 19 (IQR 8-44) days. In-hospital mortality (1.7% vs. 1.5%) and length-of-stay(4 vs. 3 days) were comparable among patients readmitted early and late(both P>0.05). On multivariable analyses, CCI (≥2: Odds Ratio [OR] 1.63, 95%CI 1.37-1.94), LOS (OR 1.02, 95%CI 1.01-1.03) and postoperative complication (OR 1.26, 95%CI 1.06-1.51) were associated with 90 day readmission. The most common reason for early and late readmission were postoperative infection (12.7%) and pneumonia (3.9%), respectively.

Conclusion: More than one third of readmissions occurred beyond 30-days after combined major surgical procedures. Assessment of only 30-day same hospital readmissions underestimates the actual impact of readmission among patients undergoing complex procedures.

11.01 A Nomogram to Predict Perioperative Blood Transfusion Among Patients Undergoing Abdominal Surgery

Y. Kim1, F. Gani1, F. Bagante1, G. A. Margonis1, D. Wagner1, L. Xu1, S. Buttner1, J. O. Wasey2, S. M. Frank2, T. M. Pawlik1 1Johns Hopkins University School Of Medicine,Surgery,Baltimore, MD, USA 2Johns Hopkins University School Of Medicine,Anesthesiology And Critical Care Medicine,Baltimore, MD, USA

Introduction: Stratifying a patient’s risk for perioperative packed red blood cell (PRBC) transfusion when planning major abdominal surgery is of interest to both patients and providers. We sought to identify preoperative factors associated with receipt of PRBC to create a nomogram that predicts an individual’s risk of transfusion with major abdominal surgery.

Methods: A nomogram to predict receipt of perioperative transfusion was constructed using a cohort of patients who underwent hepato-pancreatico-biliary (HPB)(n=2,792) and colorectal (n=2,171) surgery between 2009-2014. Discrimination and calibration of the nomogram was tested using area-under-the-curve (AUC) receiving operator curves and calibration plots.

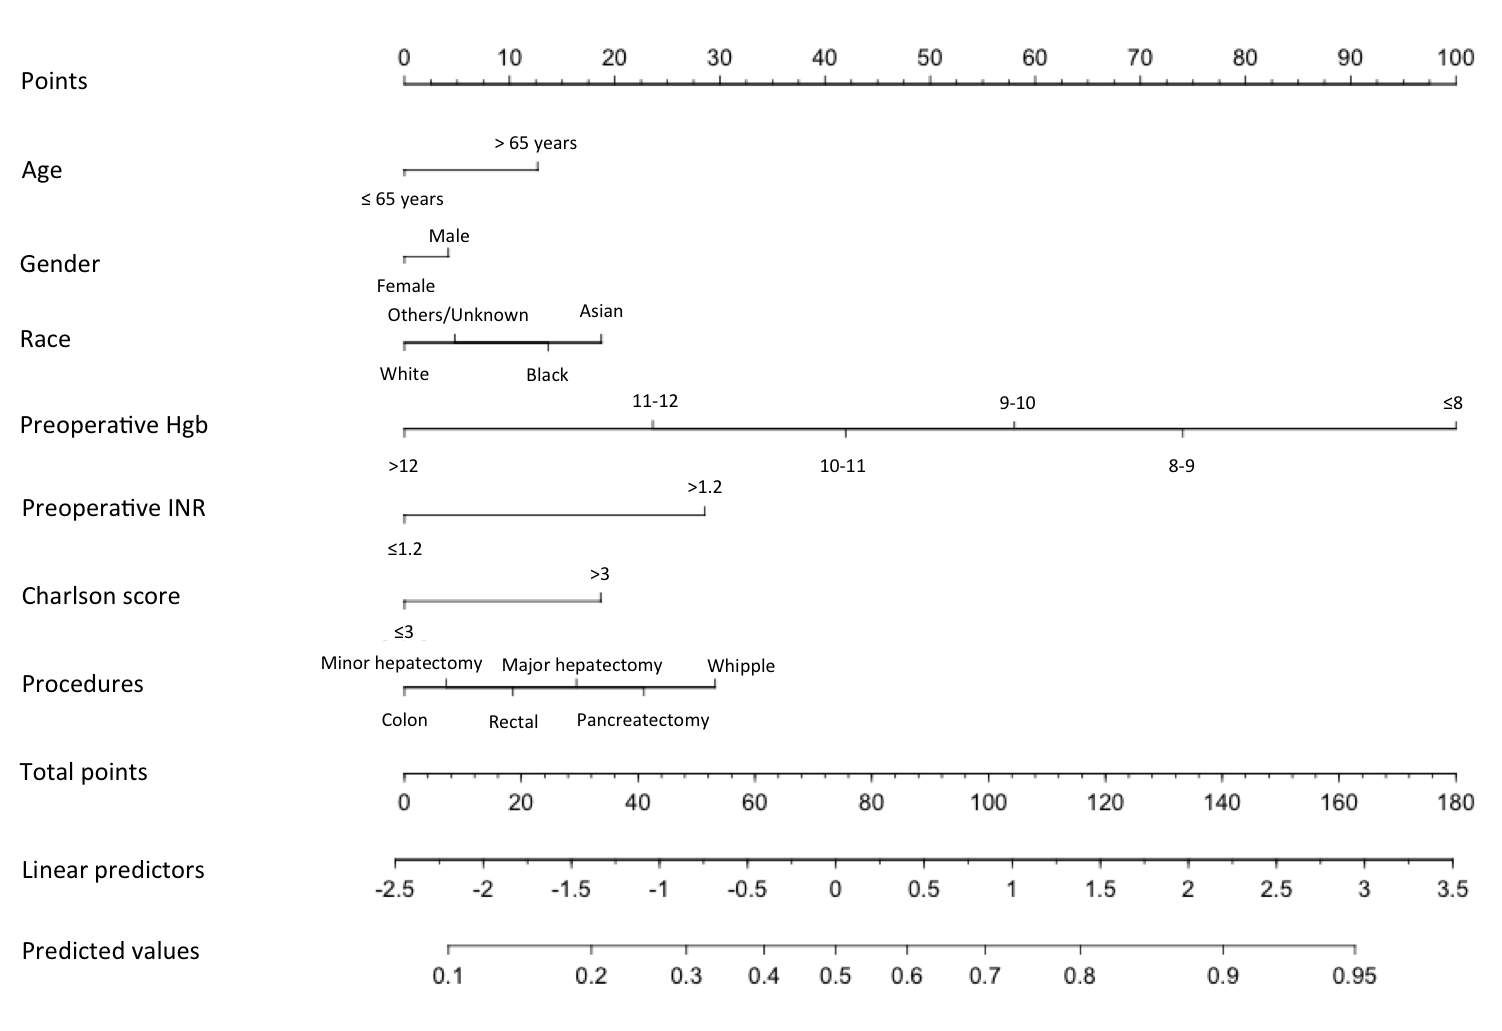
Results: Among 4,963 patients undergoing either a HPB (56.3%) or colorectal (43.7%) procedure, 1,549 received ≥1 unit of PRBC for a perioperative transfusion rate of 33.1%. On multivariable analysis, age ≥65years (OR=1.5), race (Black: OR=1.6, Asian: OR=1.9), male sex (OR=1.1), preoperative Hb ≤8g/dL (vs. >12g/dL: OR=27.5), preoperative INR>1.2 (OR=2.6), Charlson score>3 (OR=1.9), and procedure type (colon surgery, referent: minor hepatectomy OR=1.1, rectal surgery OR=1.4, major hepatectomy OR=1.7, distal pancreatectomy OR=2.1, whipple procedure OR=2.7) were associated with risk of transfusion (all P<0.05). A nomogram was constructed to predict receipt of transfusion using these variables (Figure). Discrimination and calibration of the nomogram revealed good predictive abilities (AUC 0.76). Bootstrap validation of model accuracy revealed minimal evidence of model overfit.

Conclusion: Independent preoperative variables were used to create a nomogram to predict the likelihood of PRBC transfusion. This nomogram may be useful in stratifying a patient’s risk of needing a blood transfusion around the time of major abdominal surgery.